- Advertisement -
Nasdaq-100 vs. S&P 500
Diversifying your portfolio while gaining exposure to the Nasdaq-100 Index.
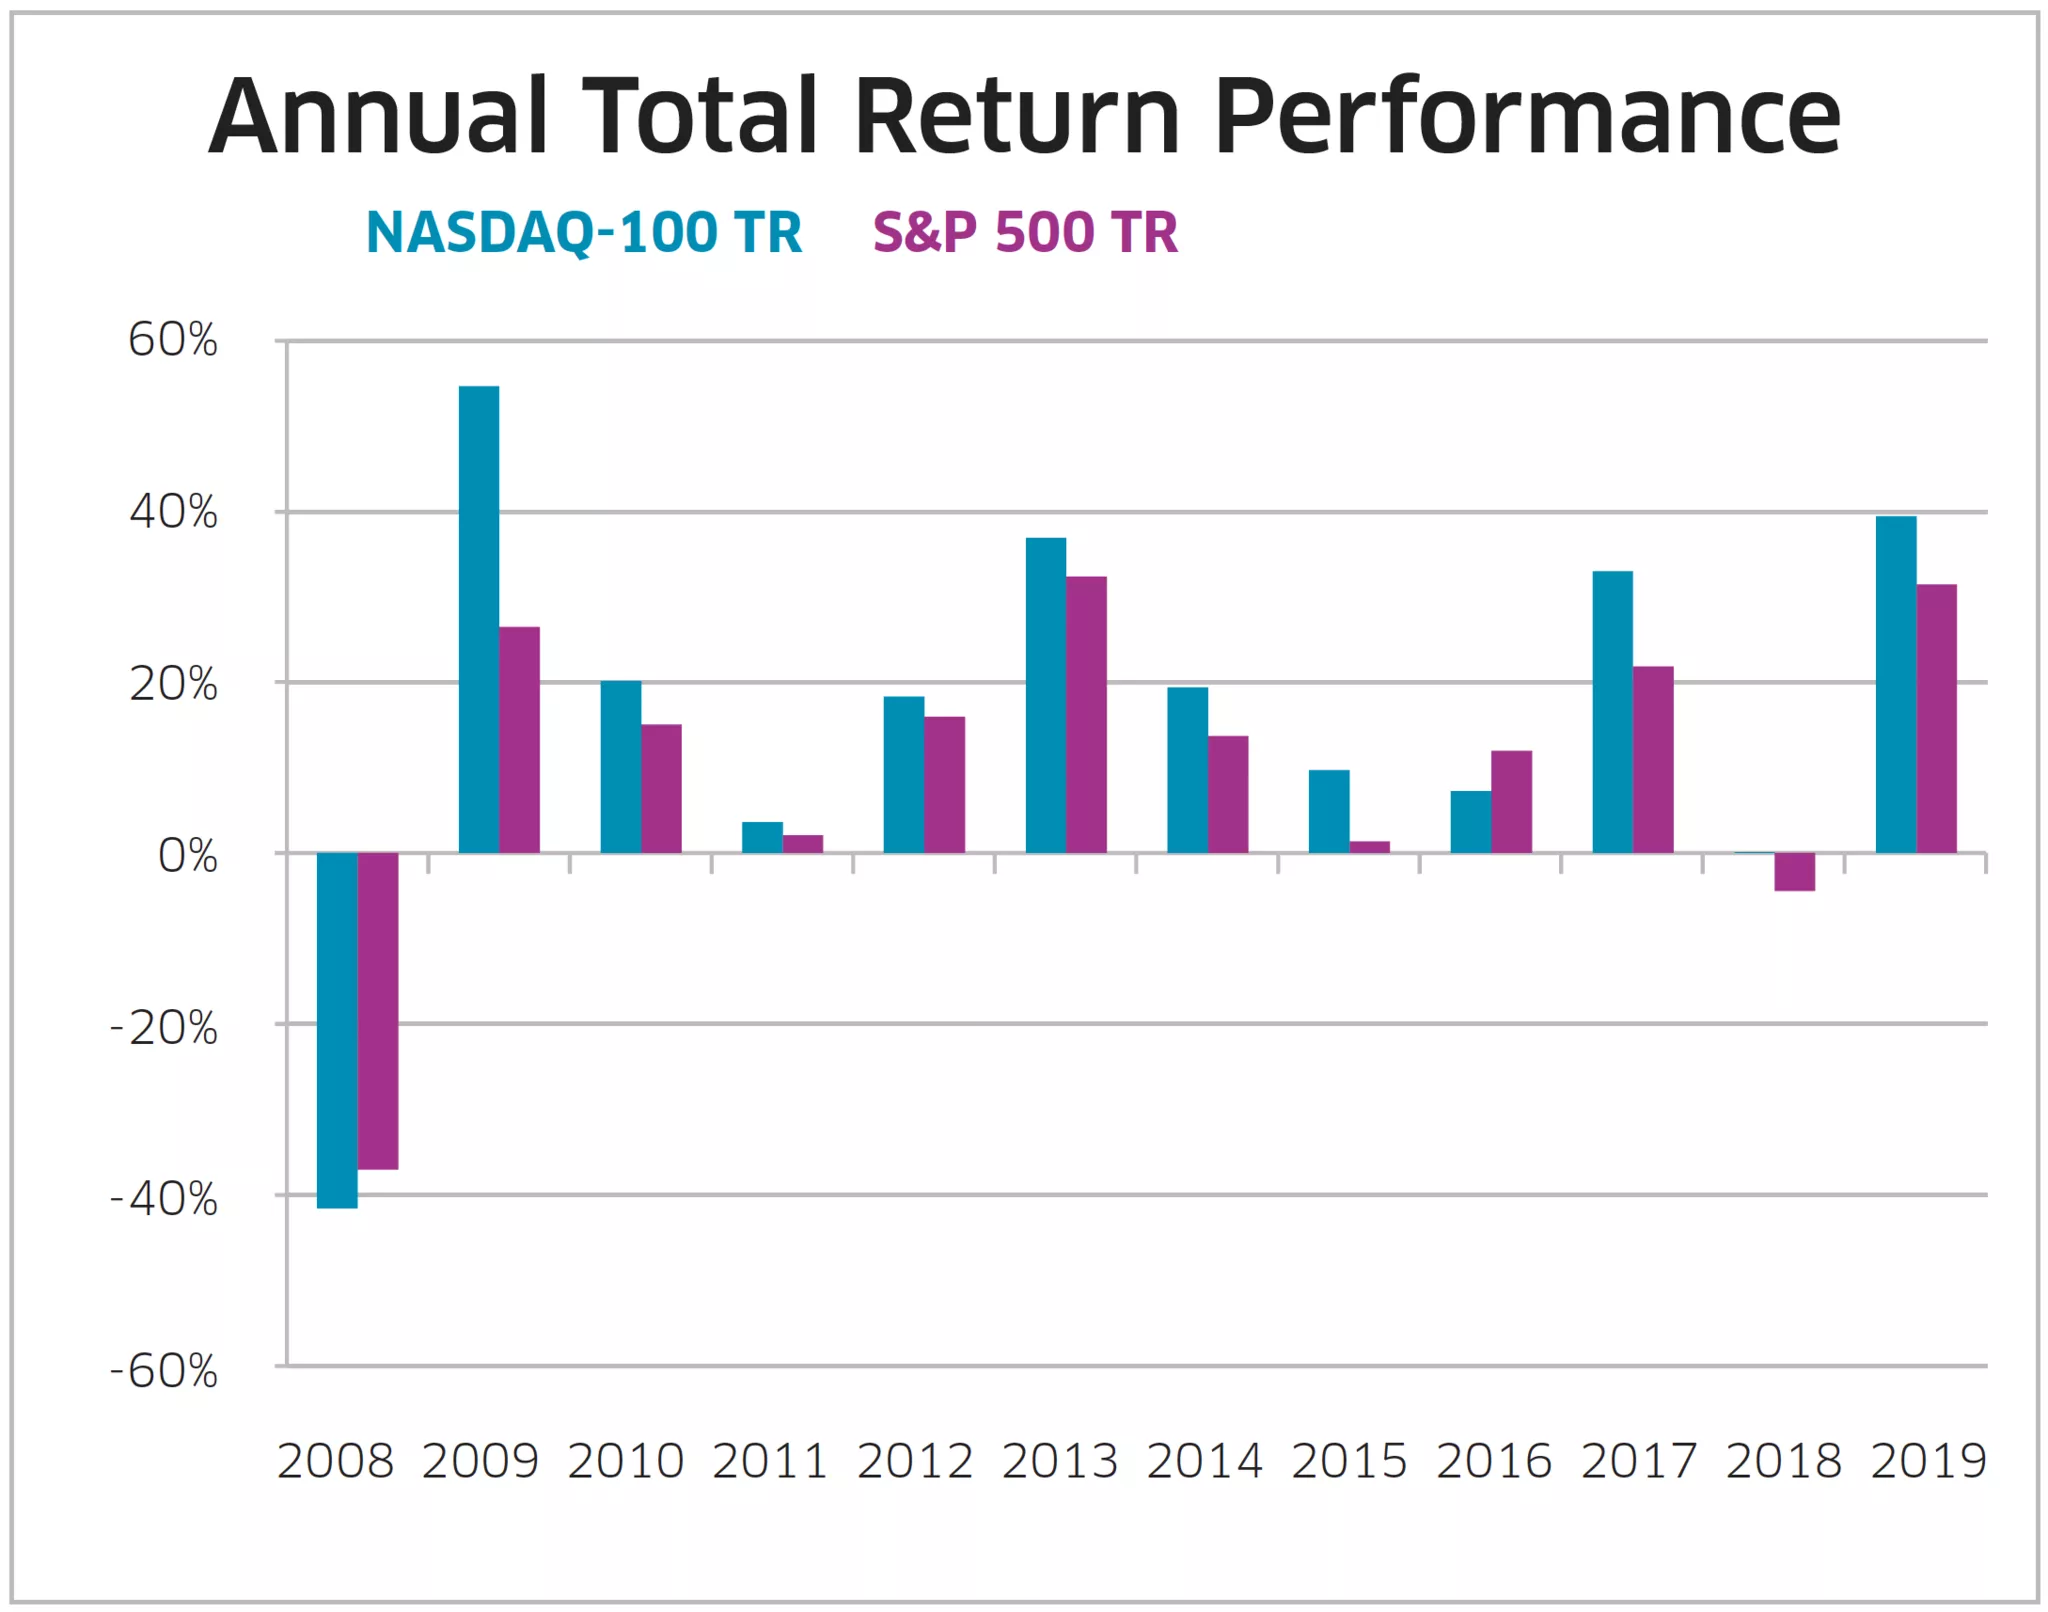
The Nasdaq-100 and S&P 500 are two of the most popular equity indexes in the US. The Nasdaq-100 is heavily allocated towards top-performing industries such as Technology, Consumer Services and Health Care, which have helped the Nasdaq-100 outperform the S&P 500 by a wide margin between December 31, 2007 and December 31, 2019. Below is a comparison of annual total returns — which reinvest dividends — between each index. The Nasdaq-100 TR Index has outperformed 10 out of the 12 years in our study.
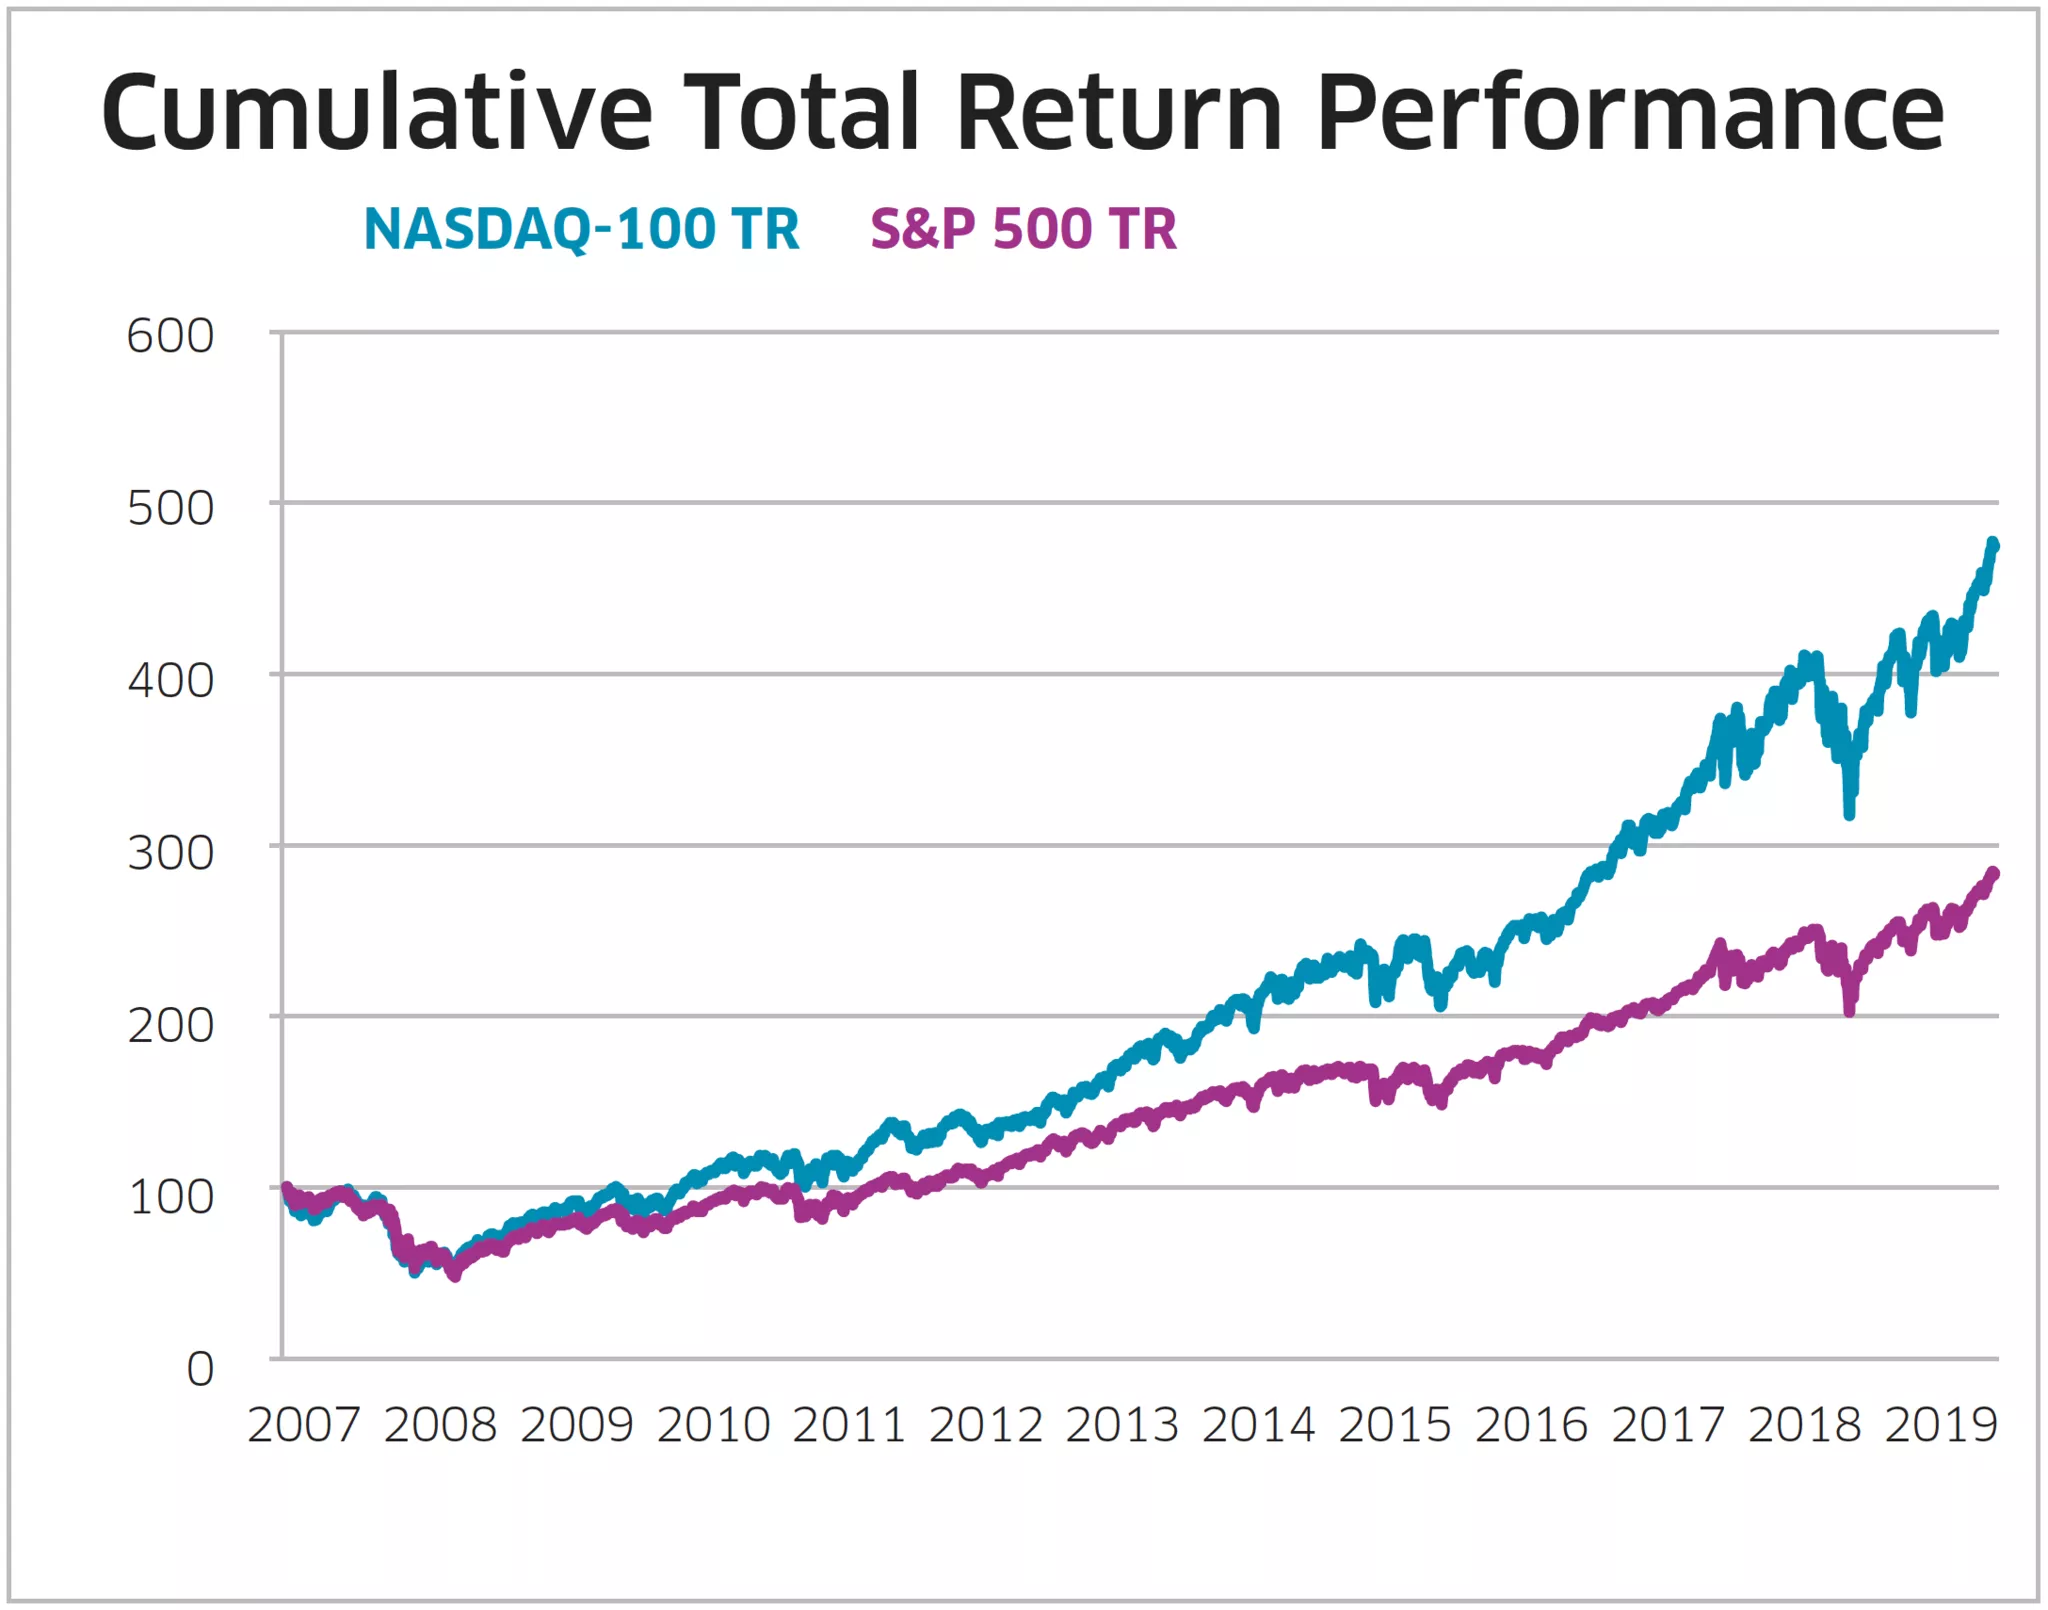
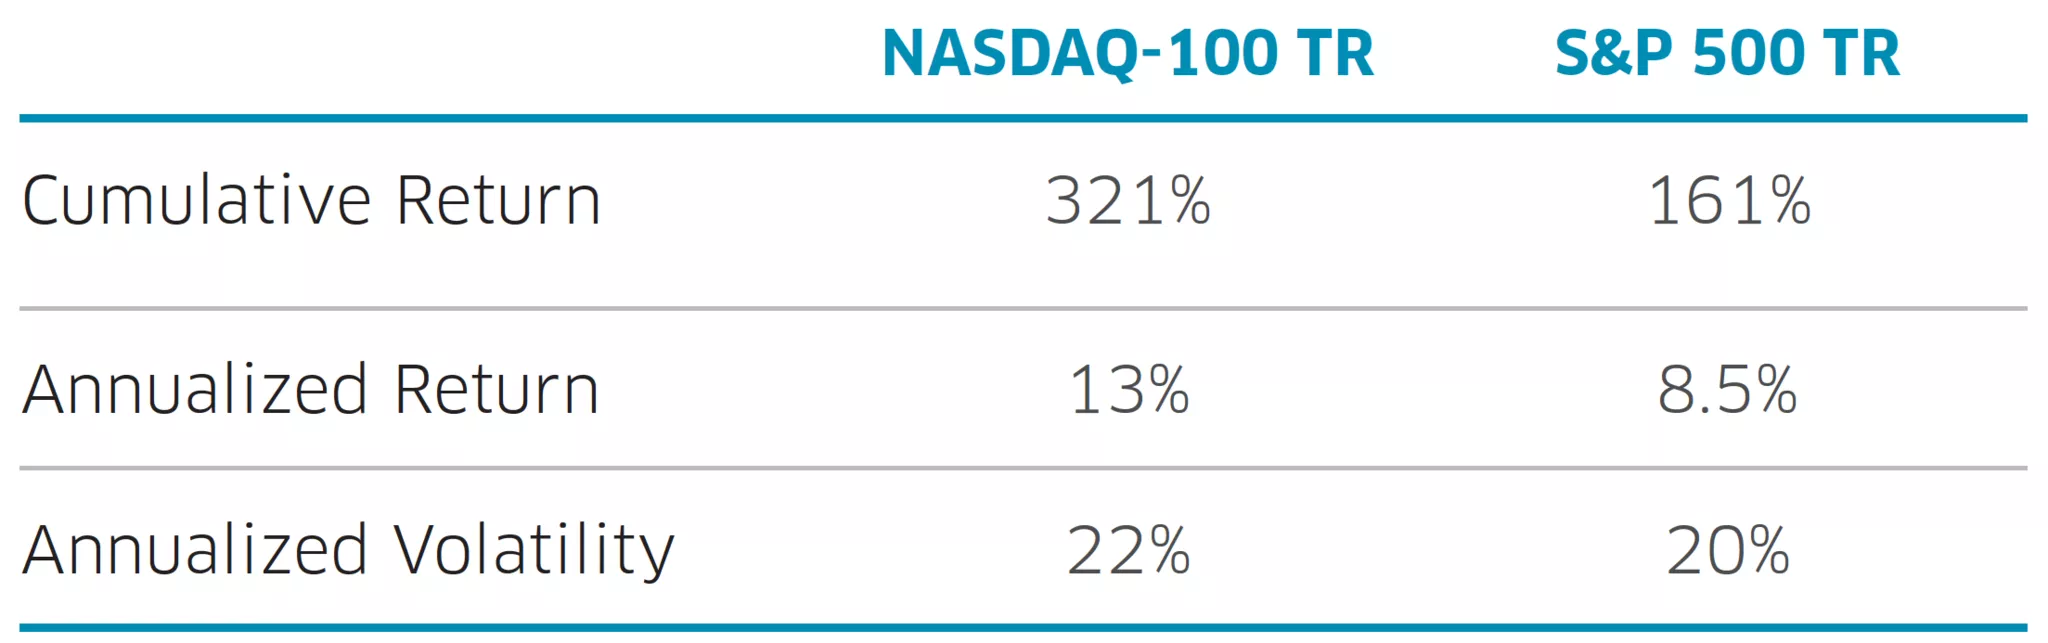
Historic Performance
The table on the right and the charts above display historical performance figures for both the Nasdaq-100 TR and the S&P 500 TR between December 31, 2007 and December 31, 2019. The Nasdaq-100 TR Index displayed more than double the cumulative total return, on just slightly higher volatility.
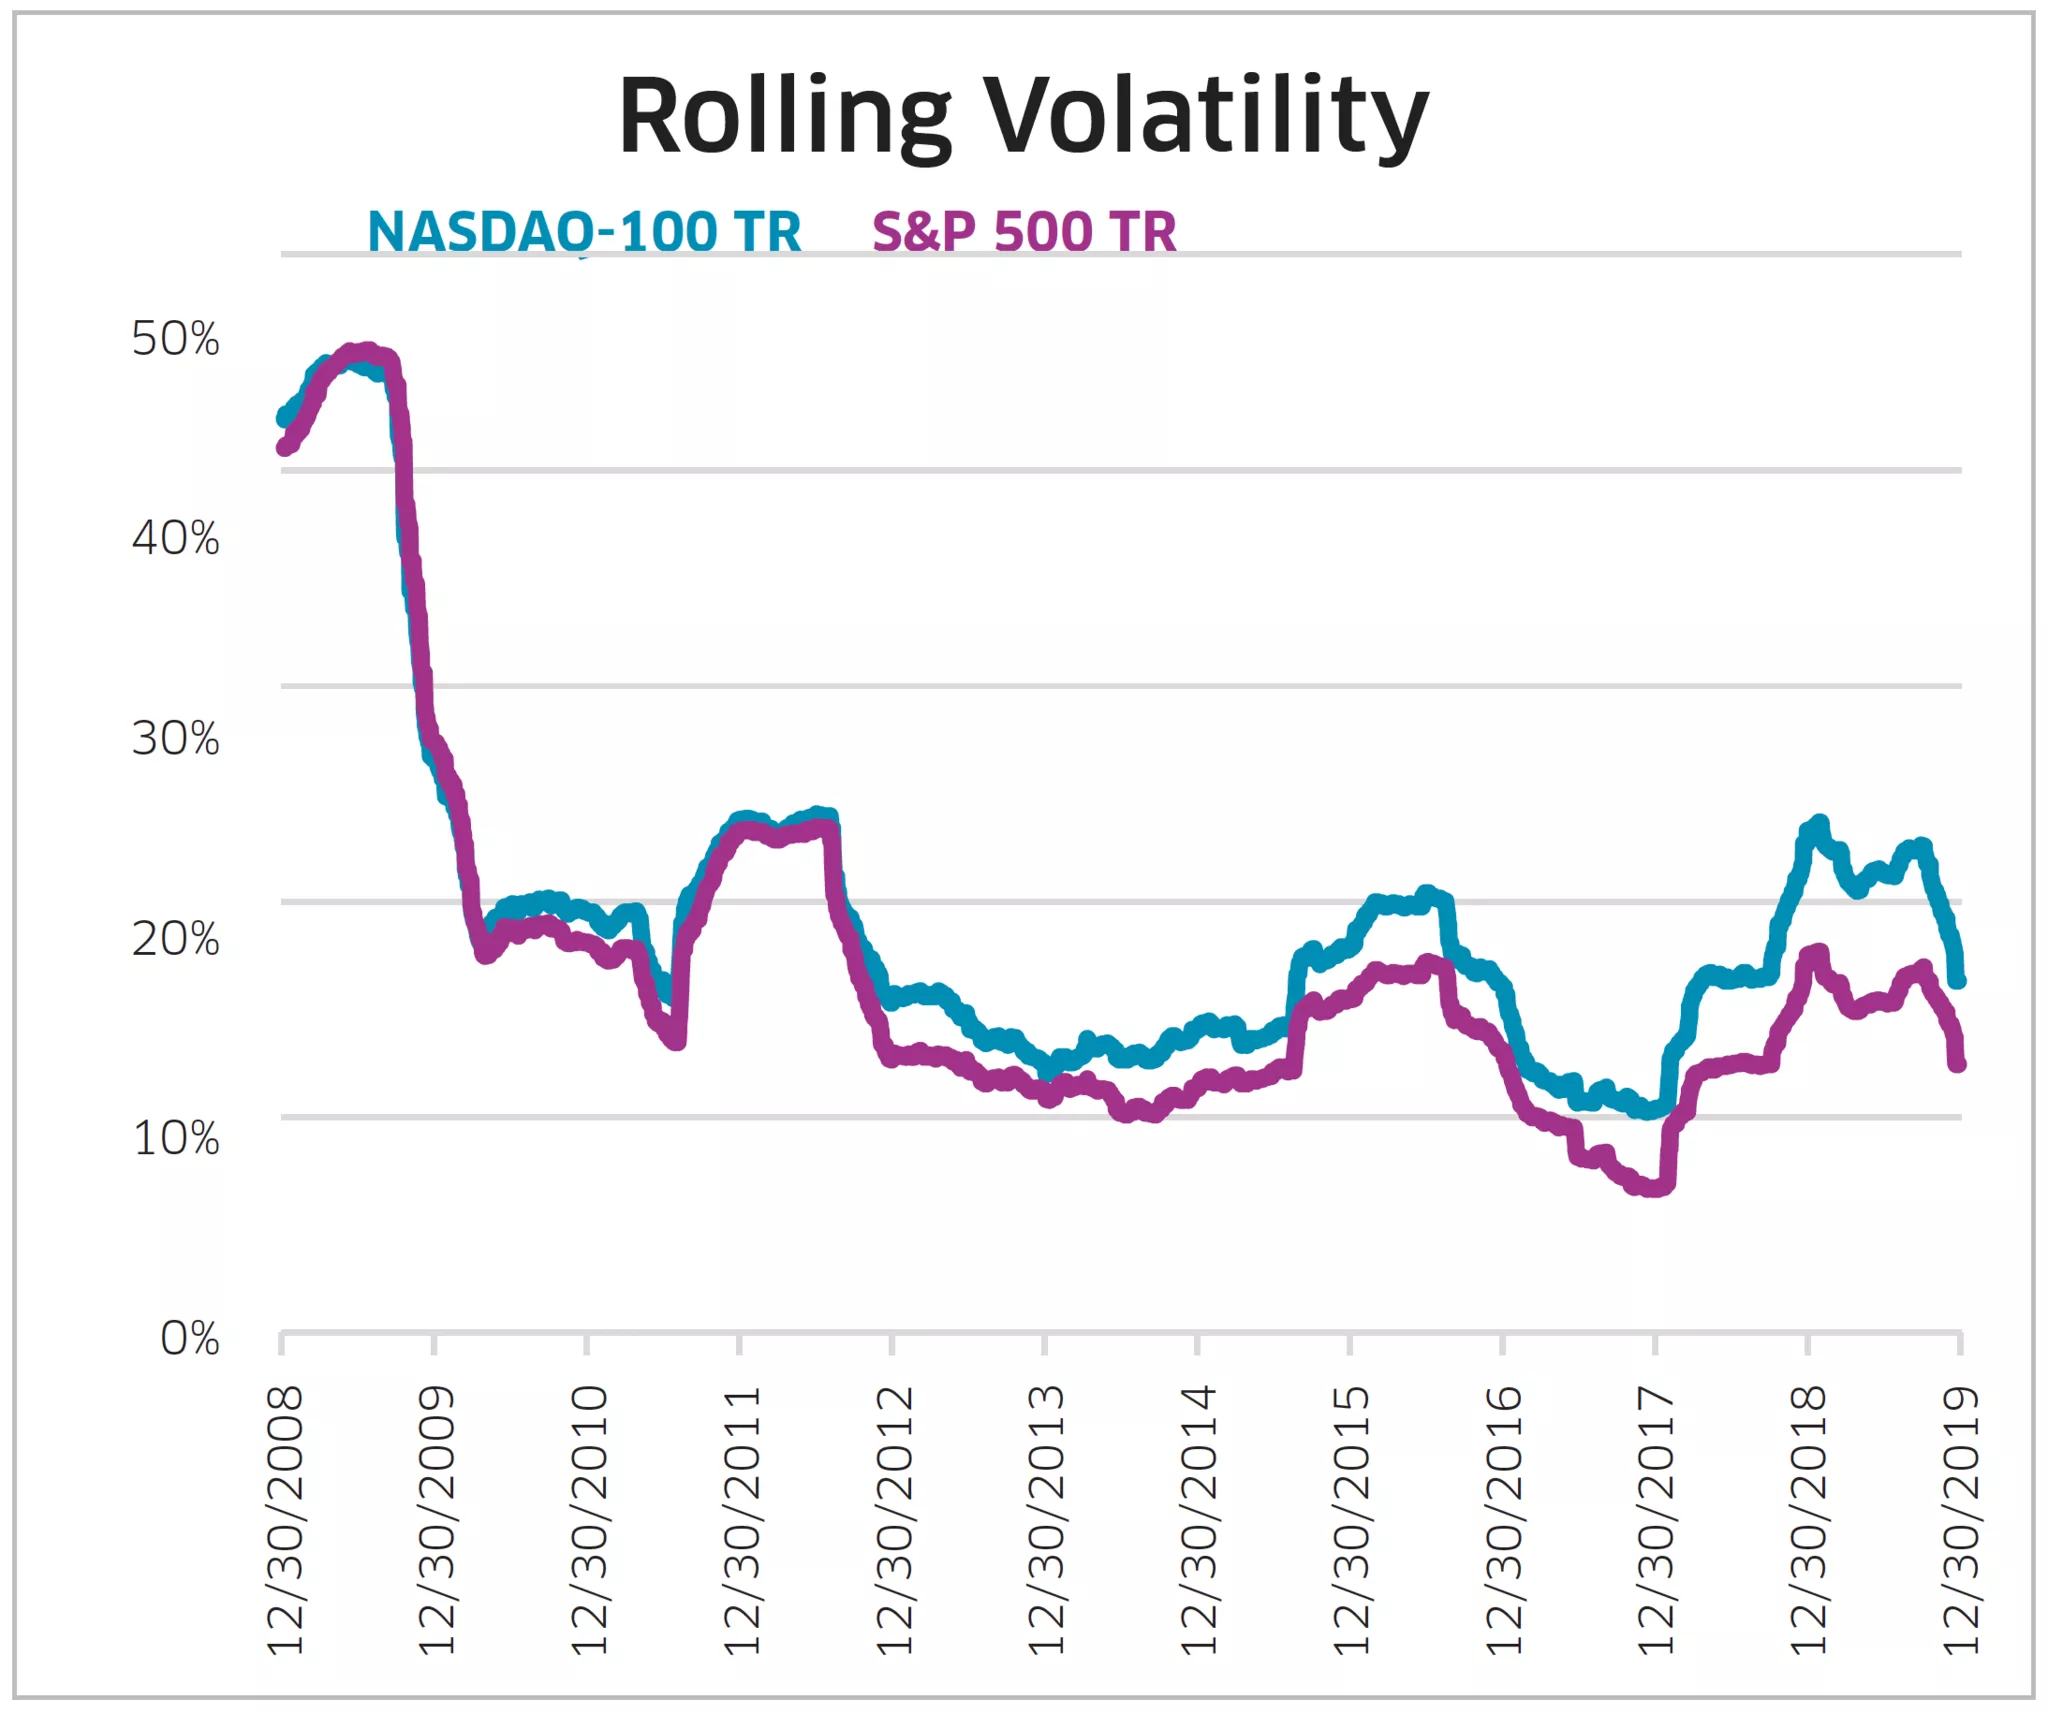
Rolling Volatility (One Year)
One year rolling volatility (calculated by taking the standard deviation of daily returns, annualized) was 93% correlated between Dec 31, 2007 and December 31, 2019, when comparing the two indexes. Given the large exposure the Nasdaq-100 has towards Technology, the ability for the Nasdaq-100 to closely track the volatility of the S&P 500 is rather impressive.
The Nasdaq-100 and S&P 500 are two of the most popular equity indexes in the US. We provided performance and volatility analysis for almost 12 years. The Nasdaq-100 is heavily allocated towards top-performing industries such as Technology, Consumer Services and Health Care. The growth of companies in these industries has continued to be strong. Given the way technology is influencing the world and making companies more efficient, this trend is more than likely to continue going forward.
- Advertisement -
- Advertisement -
- Advertisement -
Market participants looking to gain exposure to the Nasdaq-100 Index can do so through a variety of products.

Home of Science is an American monthly fashion and lifestyle magazine covering many topics including fashion, beauty, culture, living.
Latest posts by Home of Science (see all)
- Advertisement -